

Understanding these 19 valuable key metrics in marketing are important indicators to run a successful business. Learn about what you should be tracking in this article.
What is a KPI? Key metrics are also known as key performance indicators.
These are statistics that are meant to give a measurement depicting the value, health, and performance of an organization or department—all organizations, either for-profit or nonprofit, use key metrics to determine their progress accurately.
How do companies use KPIs?
Key metrics are specific to a company or organization, and as such different organizations utilize different key metrics for tracking performance. Education organizations, for instance, track the dropout rate while market departments track profitability, value, and conversion rates.
Key metrics are a simpler way to read company performance. It bypasses sophisticated analytical methods that are often used to interpret the otherwise large amounts of data collected. They allow organizations and individual departments to track metrics that are specific to their goals.
Why are KPIs important?
As we said earlier, different KPIs can measure performance in different areas of an organization or department. Companies that use KPIs as objective guidelines for achieving their goals and setting achievable goals for their employees tend to perform better.
Now that you know the importance of marketing metrics, we’ll have a look at some KPI examples.
Key metrics examples
1. Qualified leads
Qualified leads are people or corporations that are potential customers based on information that they have freely provided. By freely providing relevant information to your business, it indicates their interest in your products or services.
Examples of qualified leads include; downloading trial software versions, clicking on an ad to get to your site, using software demos, or contacting you for more information. Analyzing your qualified leads helps you get sales-ready leads and weed out leads that are less likely to commit.
2. Number of comments
Comments show how many potential customers, or not, and how those customers react to your post. The number of comments on your social media page or website should always be analyzed compared to the number of followers you have. However, the more comments you have in your post, the better.
Comments are most relevant for social media pages and websites. Placing an advertisement on your social media or websites gives your potential clients the platform to interact with your product or service. Your follower will provide you with free feedback you’ll use to improve your marketing.
3. Amount of content shared
The amount of content shared among your followers also plays a significant role as a key performance indicator. The amount of content shared among your followers not only creates rapport for your organization and its product or services but also helps promote your brand.

Share your content on social media for your target audience to see.
Placing your products on social media platforms is the surest way to promote your content among your social media followers. It goes without saying that the more your content is shared either on or off the internet, the higher the chances are that your organization will benefit.
If you’re unsure of what to be posting on your social media, you may use BiQ Content Intelligence to help you get this issue sorted out.
Assuming that you have a great keyword in hand, you need to know what goes inside your content. The typical practice for a content writer to do this is to hop over to Google, type the keyword in, and open a dozen tabs consisting of the top articles.
The problem is it takes so long and human observation is prone to error. This is where BiQ Content Intelligence comes in handy. For any keyword of the document created, the tool analyzes it with the top-performing organic content on Google.
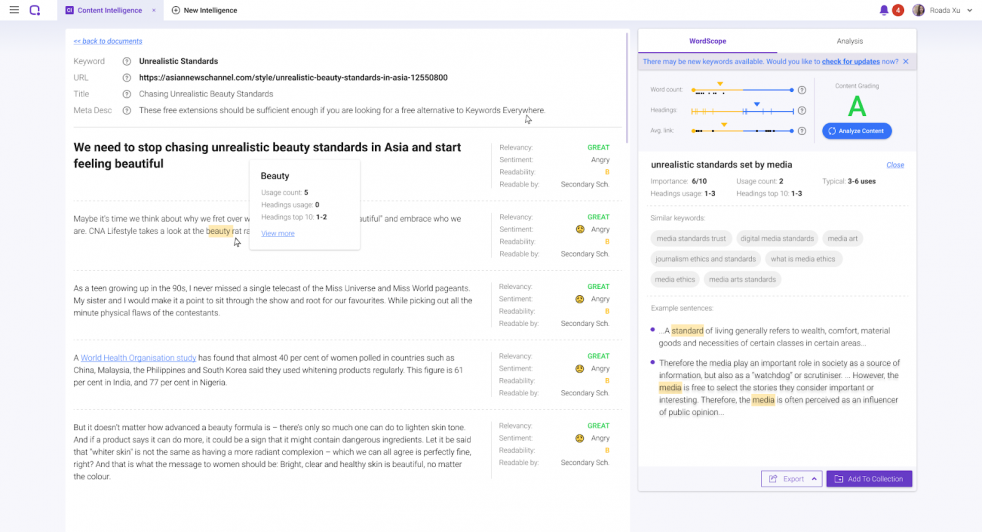
Better still, it gives you a breakdown of your keyword in terms of usage, similar keywords, and example sentences.
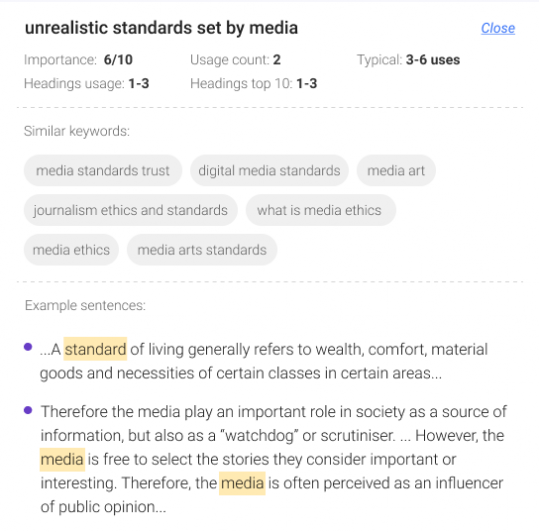
They should be the go-to source that shapes your article as you write. For example, if you’re writing about “unrealistic standards”, just by running a Wordscope analysis can get you similar keywords like media standards trust, what is media ethics, and so on.
In other words, you can’t hope to satisfy searchers who are looking for unrealistic standards without writing about these similar keywords.
You can also make use of the keywords to craft your outline! That’s an example of killing two birds with one stone effectively.
4. Customer acquisition cost
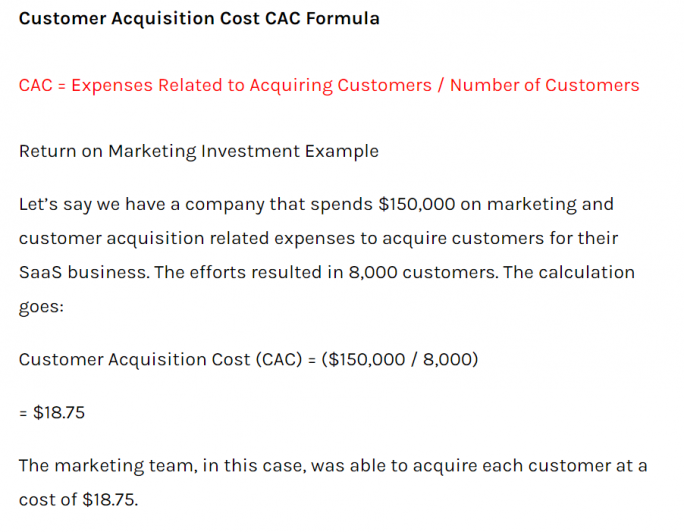
The customer acquisition cost, also known as the CAC, is calculated by dividing the number of expenses you invested in acquiring new clients by the actual number of clients you got. If you spent $200 on marketing and got 200 customers, then your CAC is $2.00.
Customer acquisition cost is significant since it can determine if a particular marketing strategy works well for your company. Ideally, your CAC should be lower than the LTV (lifetime value of your customer).
5. Time spent on site
Time spent on site is the average time that a customer spent on your site. When you look at this information, you should also consider the number of pages they visited and how long they took on each page.
You should analyze the metrics based on the type of content you have on each page to understand your site better. The information you gain will help you redesign your page to make it more appealing and more accessible, helping you improve sales.
6. Monthly recurring revenue
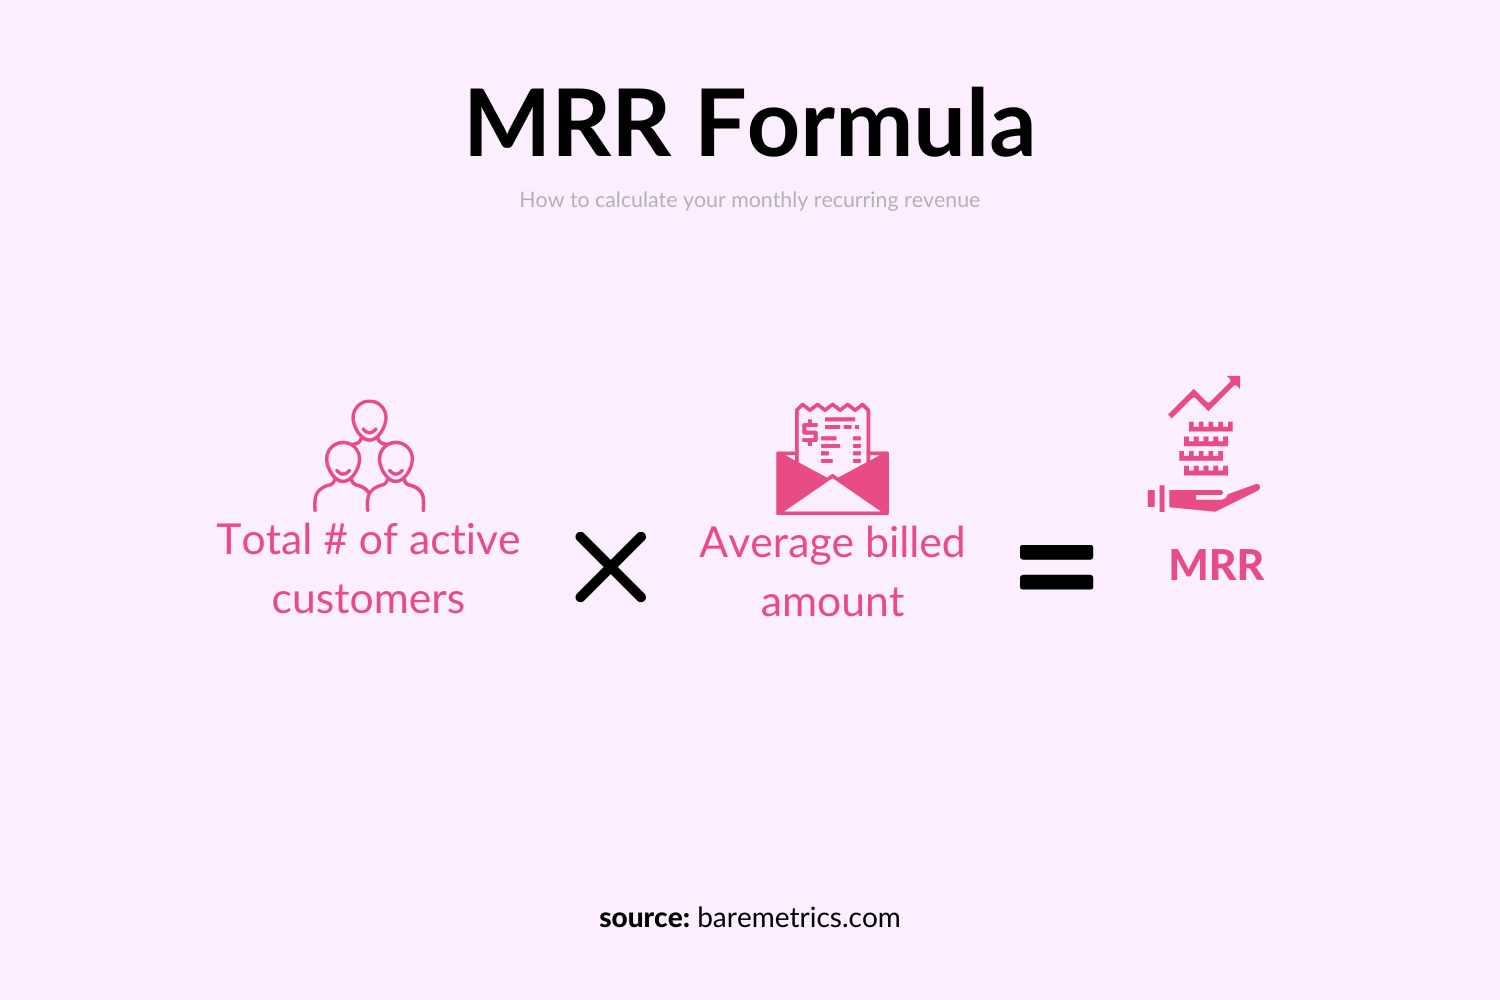
Monthly recurring revenue, also known as MRR, is one of the most important metrics that your business or organization needs to monitor. You should measure the changes in your net monthly value to determine how much money you are investing and if your company gets any returns.
Monitoring your company’s monthly recurring expenditures helps you determine your budget and how you may need to re-adjust it accordingly. It helps keep you accountable for your expenditure, which may help prevent losses or correct misappropriations before they get too far to be fixed.
7. Bounce rate

Your bounce rate refers to the number of people who leave your website without opening any other pages. Using this metric can help you know how effective your website’s layout and design are, especially for your landing page.
Improving your website’s user interface and aesthetics could be a great way to retain more people on your site and get them to view your other pages. It would help if you also changed the layout so that it becomes easy for your viewers to find and interact with your products.
A bounce rate of 26-40% is considered excellent.
8. Conversion rate

The conversion rate is reached by dividing sales by the total number of visitors your site receives in a month. If, for instance, you get 200 visitors in a month and you make 50 conversions in that month, then your conversion rate will be 25%.
You can have different conversion rates for different aspects of your website, such as clicks to making actual purchases. Conversion rates can be used to determine your website’s performance. You can use conversion rates to determine the weak links in your website and help you make some improvements.
Conversion rates differ from one industry to the other, but they generally hover at around 2-3%; however, you should aim for conversion rates for approximately 5% conversion rates if you want to create specific landings for specific target audiences.
9. Number of trial signups
Using free trial signups is a great way to determine your customers’ first impressions of your product, and how many of them convert to actual buyers. You could use a conversion funnel to help you sort these two groups out; the trial signups and the actual, eventual buyers.
Like software engineers, most businesses often offer their products as a trial version for a few days or a week before their customers are expected to pay for the services. Using this metric helps you determine how many customers are interested in your product.
It also helps you measure the performance of your first-touch marketing efforts.
10. Web traffic sources

The web traffic sources metric measures are used to determine which of your sources drive traffic to your website. The metrics compare and contrast all those different sources by measuring the number of visitors from each source.
There are three major sources, direct traffic- visitors who visit your site by typing in the URL, referral traffic- those who visit your site by clicking on your URL on another site and organic search traffic for those who find your website by searching for a keyword in a search engine.
The fourth source is through banners and campaigns.
Web traffic sources are important, especially for your website, since they tell you exactly where your traffic is coming from and at what rate. Using this information could improve traffic sources that may be lagging to help drive more traffic to your website.
11. Customer lifetime value (CLV)
The customer lifetime value is the amount of money your customer is expected to spend on your business throughout their lifetime. To get this, you need to get your customer’s average purchase value and multiply it by the average purchase frequency; that’s the customer value.
To get the customer’s average lifetime value, you need to get their average lifetime and multiply that by the customer value. Getting your customer’s CLV helps determine how much profit you may end up getting from a potential client during their lifetime and how much you’re willing to invest in them.
12. Customer churn rate
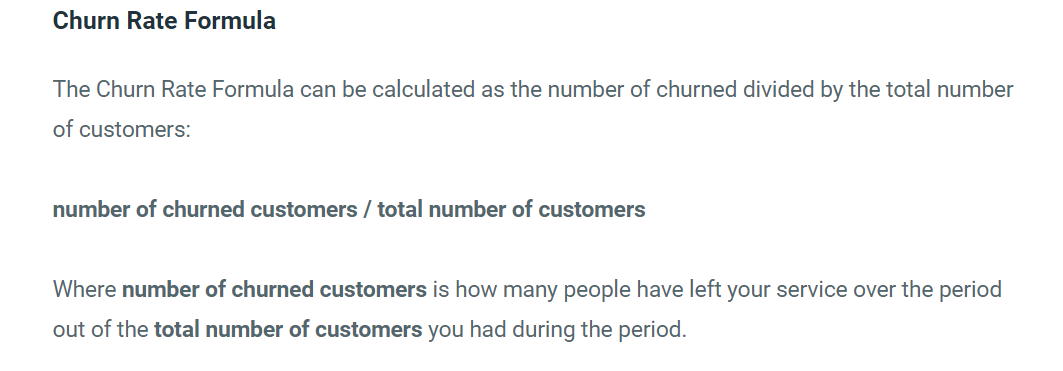
The customer churn rate refers to the number of customers a company loses within a specific period of time over the initial number. The churn rate KPI metric is important since it highlights how different processes affect customers and your company’s growth roadblocks.
Getting new customers is often harder than retaining those customers you already have; however, some churn rates of about 5-7% or below annually from among your customers are expected. Churn rates, however low they are, indicate deeper operational issues that need to be fixed.
13. Cost per lead

Cost per lead refers to the number of investments you make to reach one potential customer. A lead is an individual that expresses interest in your product. You get the cost per lead by dividing the cost of resources you spent to acquire your leads by the number of leads you got in a specific period of time.
If, for instance, you spent $500 in a month through marketing campaigns, you should divide this by the total number of leads you get, let’s say 50, to get a cost per lead of $10. Calculating the cost per lead helps you determine the effectiveness and worth of your marketing campaign.
14. Click-through rate
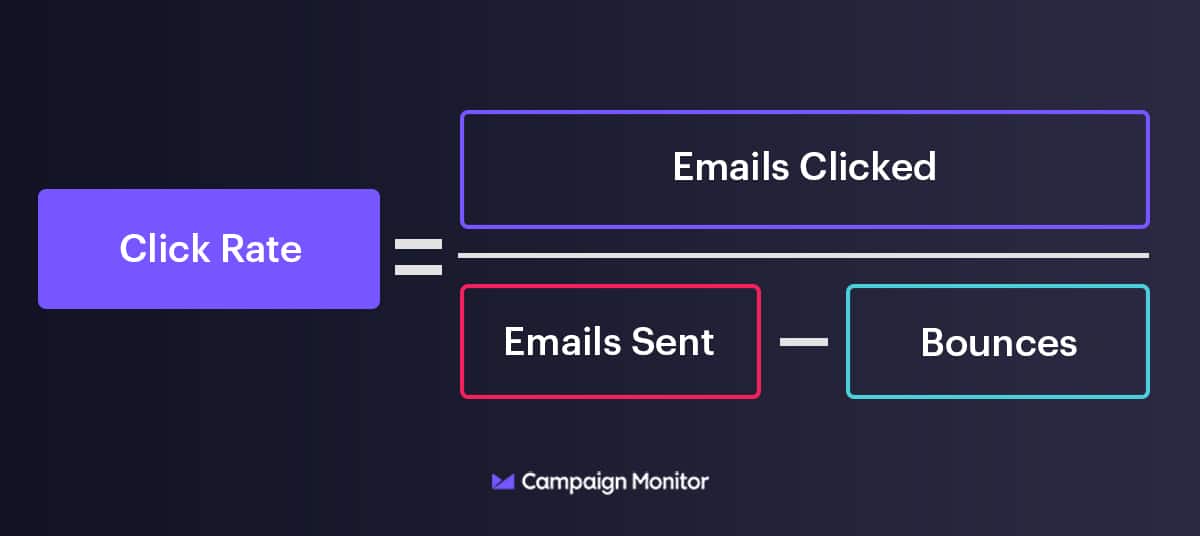
The click-through rate refers to the number of users who click on ads compared to the total number of users who view the actual page. Its common application is in measuring the effectiveness of an online ad campaign for particular websites and even emails.
The average click-through rate for AdWords is 5% for searches and 0.5-1% for display networks. You could use click-through rates to redesign your ad campaign and to promote better results, and get more potential customers to your site.
15. Content downloads
Content downloads can be used to measure the total number of clients with an express interest in your product. The total number of content downloads can be used to measure your ad campaign and marketing strategy’s effectiveness.
Making it easy for your customers to access your downloadable content is important since it helps them gain more satisfaction and increases the chances of coming to your website or page for more products.
Your ad and marketing strategies should be strategized so that they lead directly to your downloadable content for better conversions.
16. Newsletter sign up conversion rates
Newsletter sign-up conversion rates refer to the number of users who visit your site and end up signing for a newsletter. These metrics can be used to measure your content performance, messaging, and key site action. It can also be used to measure your advertisements and content placements on your site.
The average newsletter conversion rates for the top 10% of websites have been around 6.5%, while the bottom 25% has been around 0.82%, with the average being 2.9%. You should ensure that you place captivating content on your landing page to boost your conversion rates.
17. Top viewed posts
Your top-viewed posts will help you determine the best page layout that drives more traffic to your website. Adapting this layout to your subsequent post will boost your traffic and help drive even more users to your website.
18. Unsubscribes
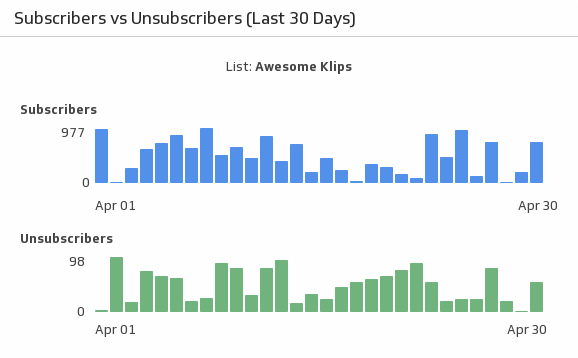
Comparing your subscribers to the number of people unsubscribing to your newsletters or your social media page helps you put your company’s metrics in perspective.
Email vendors like Gmail, for instance, have introduced the unsubscribe option where they ask users if they want to unsubscribe from certain promotional emails, which was due to the low email open rate.
To get around this, you need to make your emails more engaging to prompt more users into opening them.
19. Traffic by device
Knowing how your users access your website is important since it helps you design your website to accommodate users from the most common devices, i.e., tablets, smartphones, or laptops. In 2015, for instance, internet access through smartphones exceeded that of laptops.
Designing your website to accommodate these users helps enhance their user experience while browsing your site, which increases the chances of them staying on for a while longer.
Conclusion
To sum it up, this list of key performance indicators is critical to companies since they can evaluate the company and determine what changes need to be made to save on expenses. However, not all key metrics may work for all companies; you need to look for the relevant KPI.